No one sets out to create a product for the sake of creating a product. You want to make sure that there are people using it and, ideally, thrilled with it. That’s why engagement is such a massive goal for any product or customer-focused SaaS team.
But “engagement” can seem a little vague. What exactly does that mean?
That’s essentially what customer engagement analytics helps to make concrete. This involves collecting, measuring, and analyzing data on how your customers interact with your product. The goal is to use this data to help you understand your user’s behavior and preferences to drive more engagement in the future.
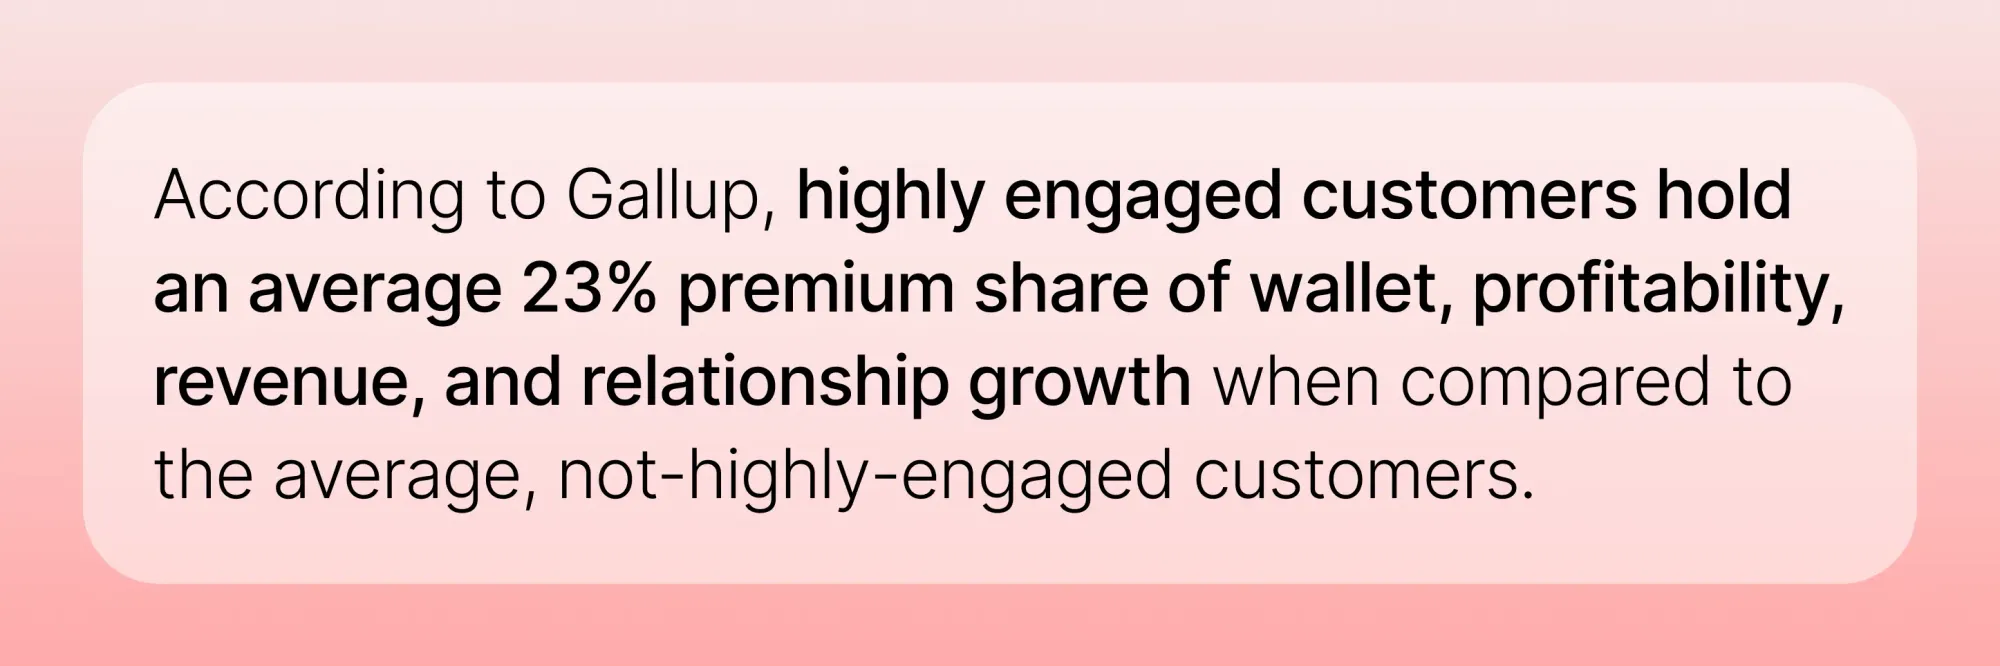
And this is a worthy feat to invest your time and resources into. According to Gallup, highly engaged customers hold an average 23% premium share of wallet, profitability, revenue, and relationship growth when compared to the average, not-highly-engaged customers.
When you’re intentional about measuring the right customer engagement metrics, you’re able to go beyond gut instinct and lean on data-driven insights. This helps you grow strategically and detect problems before they blow up into major issues.
The most important metrics
Some people like to rely on metrics like NPS or CSAT to measure engagement, but that’s really measuring feelings, not actions. For example, someone may be extremely likely to recommend something to their friends who have slightly different needs or a different budget, but that doesn’t necessarily mean that they will continue to buy that product themselves.
This mismatch between what these metrics are trying to measure and what they’re actually measuring is why so many have come under fire as little more than a box to check in a boardroom.
The best way to truly gauge customer engagement is to remove self-reporting from the equation and track the actual actions that your customers are taking.
Although what exactly “good engagement” means can vary from product to product or company to company, there are a few key metrics that get to the heart of how deeply your users are engaging with your product.
Retention rate
Retention rate is one of the best metrics to integrate into your customer engagement analytics strategy. This metric helps you track the percentage of customers who continue paying for your product over a certain period of time.
Retention is a highly effective way to measure customer engagement because put simply, engaged users tend to stay. People don’t love continuing to spend money on a product that they don’t feel like they’re getting the most out of.
This metric essentially shows you how effectively you are harnessing positive emotions and encouraging continuous use of your product.
And retention has a straight line to your revenue. Research shows that a 5% increase in retention can boost your overall profits by 25%. So the cliche that it costs more money to get new customers than to keep current customers stands true.
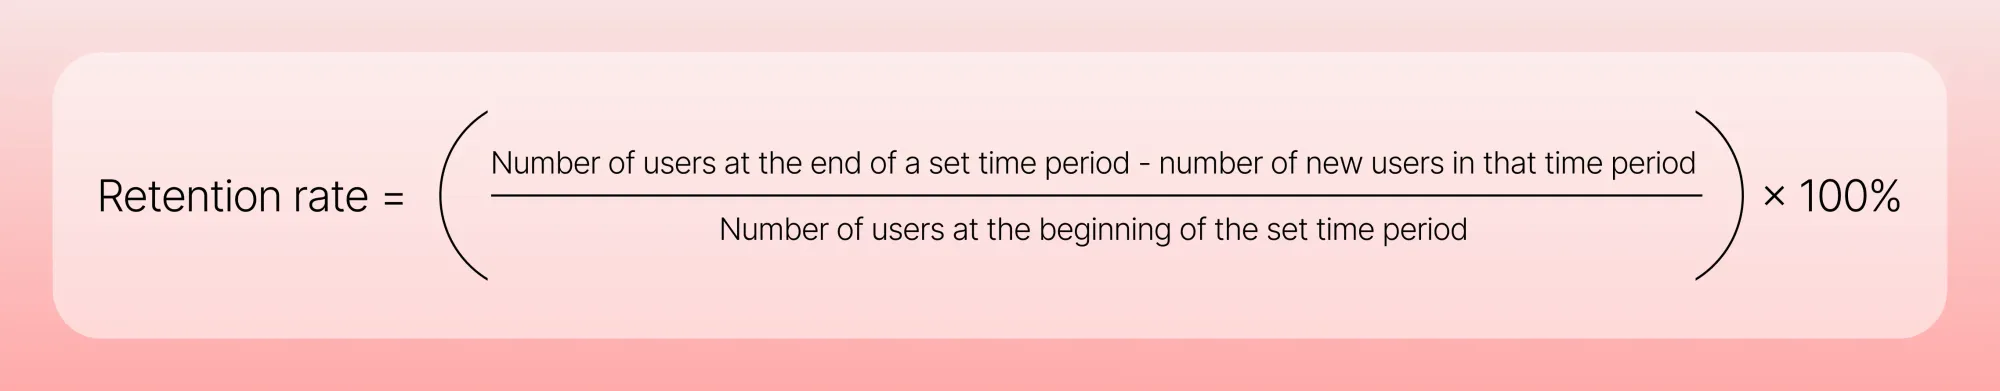
To calculate retention rate:
(Number of users at the end of a set time period - number of new users in that time period) / Number of users at the beginning of the set time period) x 100%.
You can track this at an account level (i.e. an enterprise account with 1000 users would just be counted as 1 customer) or a user level (i.e. the enterprise account mentioned above would be counted as 1000 users).
For example, let’s say you decide to track your retention on a quarterly basis. At the beginning of the quarter, you have 500 users. Throughout the quarter you gained 50 users. At the end of the quarter, you have 535 users. Your retention rate would be (535-50)/500 = 485/500 = 0.97 x 100% = 97%.
Click-through rate
Click-through rate is a metric that’s often used in marketing or sales campaigns, but it’s also a highly valuable metric to track for your customer engagement analytics. This metric refers to the users who click on buttons or links that they come across in emails, in-app pop-ups, your website, your knowledge base, or any other place where they interact with your brand.
So why does a click demonstrate engagement? It shows that your users have a desire to learn more.
Let’s say you show an in-app pop-up that shows off a brand-new feature that they might like. A user who clicks on the pop-up to hear more about this new feature is likely much more invested than someone who sees the pop-up and ignores it.
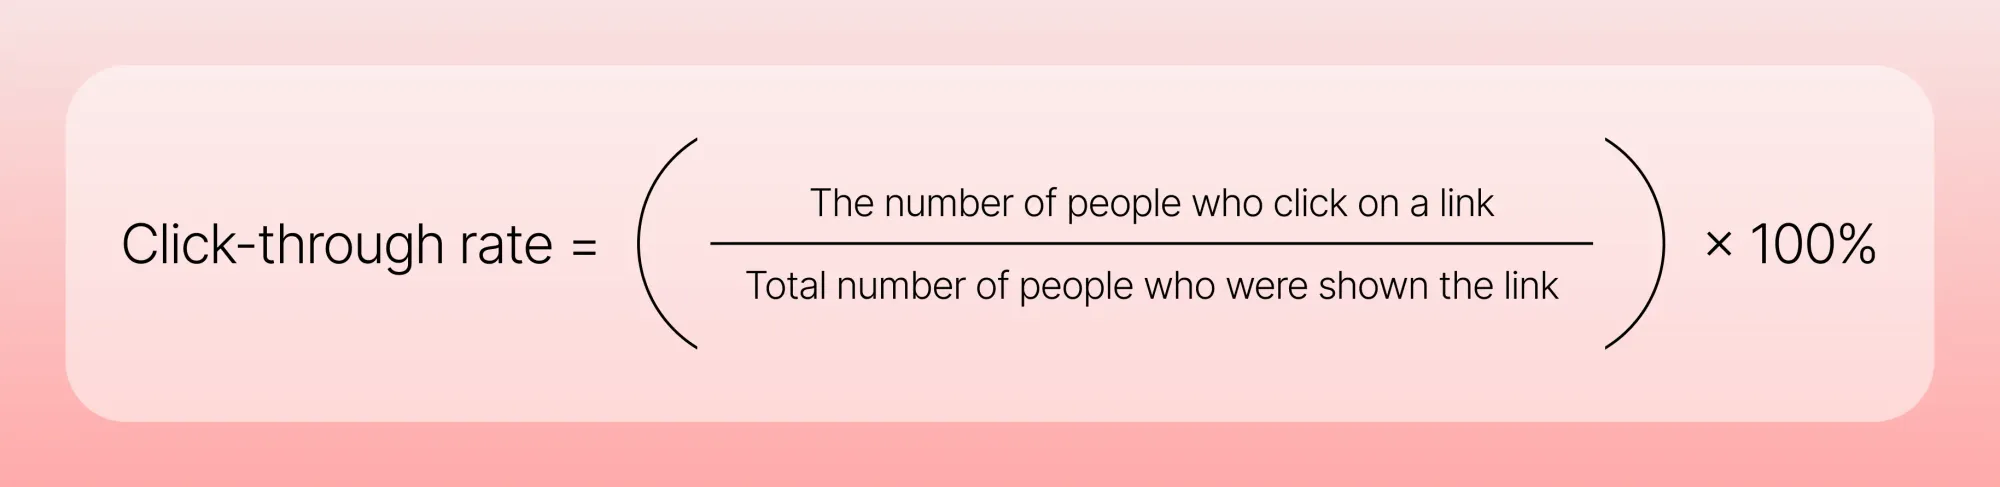
To calculate click-through rate:
Divide the number of people who click on a link by the total number of people who were shown the link, then multiply that number by 100%.
For example, if 10 people click a link on a monthly customer update email that you send to 100 people (and none of those 100 emails bounce), your click-through rate is 10%.
Chatbot sentiment analysis
I mentioned earlier that people often use self-reported metrics like NPS or CSAT to get to the heart of what their customers feel about their brand. A better method to get this understanding, though, is through sentiment analysis so that you can understand these emotions without having to explicitly ask.
Using this strategy, algorithms analyze both the words and the tone that customers use when interacting with your bots to understand how they feel, ranging from anything from happy to sad to frustrated to angry.
Although sentiment analysis was possible before, pulling information from support messages, chat records, and social listening, the explosion of conversational AI has given companies more data and deeper data than ever.
If you’ve deployed chat agents powered by conversational AI, you’re getting large amounts of data directly from your chat records. And it’s not just responses to pre-formatted questions. Your bots can probe deeper, pulling more meaningful insights from your users. Since users are able to speak to these “agents” in their own unique language and receive responses in a similar language/tone, they’re more likely to provide valuable information that can help you detect their level of both satisfaction and engagement.
Frequency of use
Highly engaged customers are more likely to use your platform more often. They see the value in it, so they keep coming back. Frequency of use is the best way to track this.
You can either track this on a platform-wide level or a feature-specific level. What you choose will differ based on your goals. For example, if you have free features that tons of customers use and never upgrade from, you may not want to figure these features into your calculation.
Another example: you just launched a new feature that is pretty complex, so ideally users should be visiting it at least weekly to get value out of it. In this scenario, it may make sense to track the frequency of use for this specific feature.
In other companies, tracking any sign-on to their platform in general may be a good indicator of engagement. This may be the case of consumption products like social media or streaming apps.
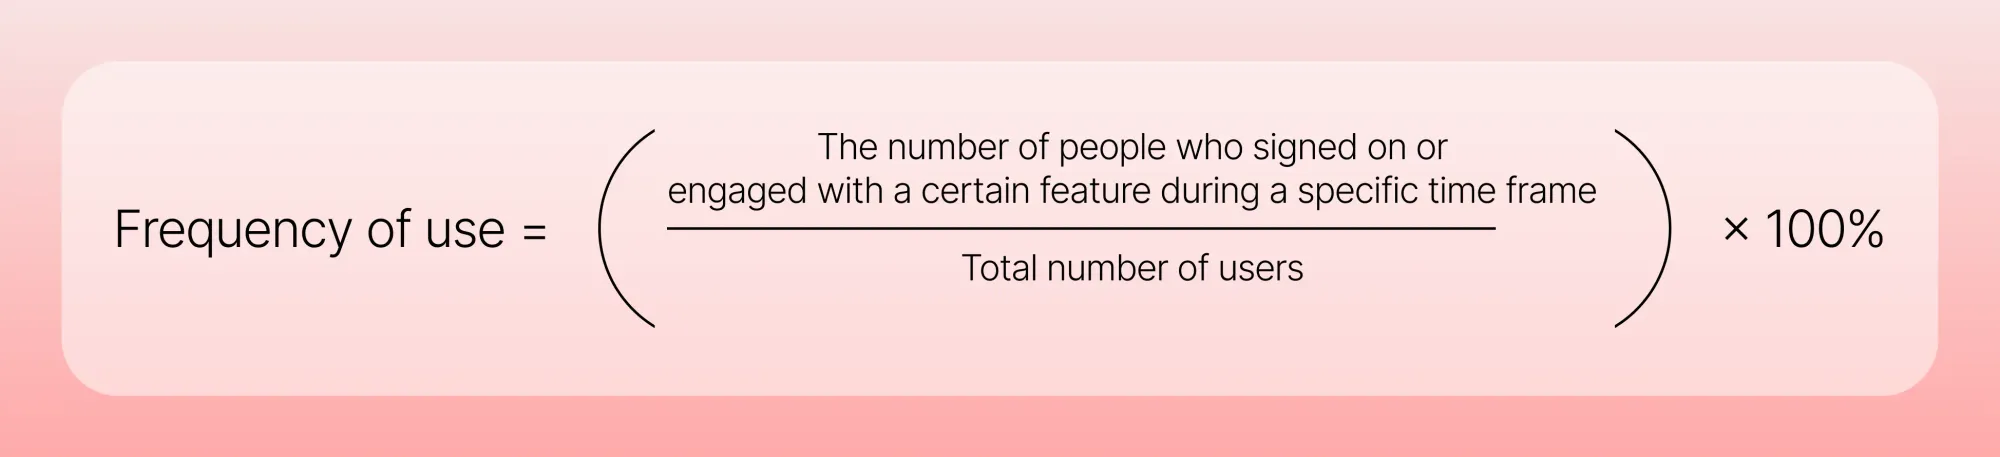
To measure frequency of use, divide the number of people who signed on or engaged with a certain feature during a specific time frame by your total number of users. You could track this on any time frame that suits your needs. Some teams may opt to track their average daily users throughout an entire quarter, while others may want to just track monthly users each month.
Time spent in platform
Tracking time spent in platform delivers a similar value as frequency of use, but rather than measuring how often a user hops on your platform, it measures how long they spend on your platform.
Users who quickly sign on, poke around, and then sign off have a clearly lower level of engagement than users who sign on and stay for hours.
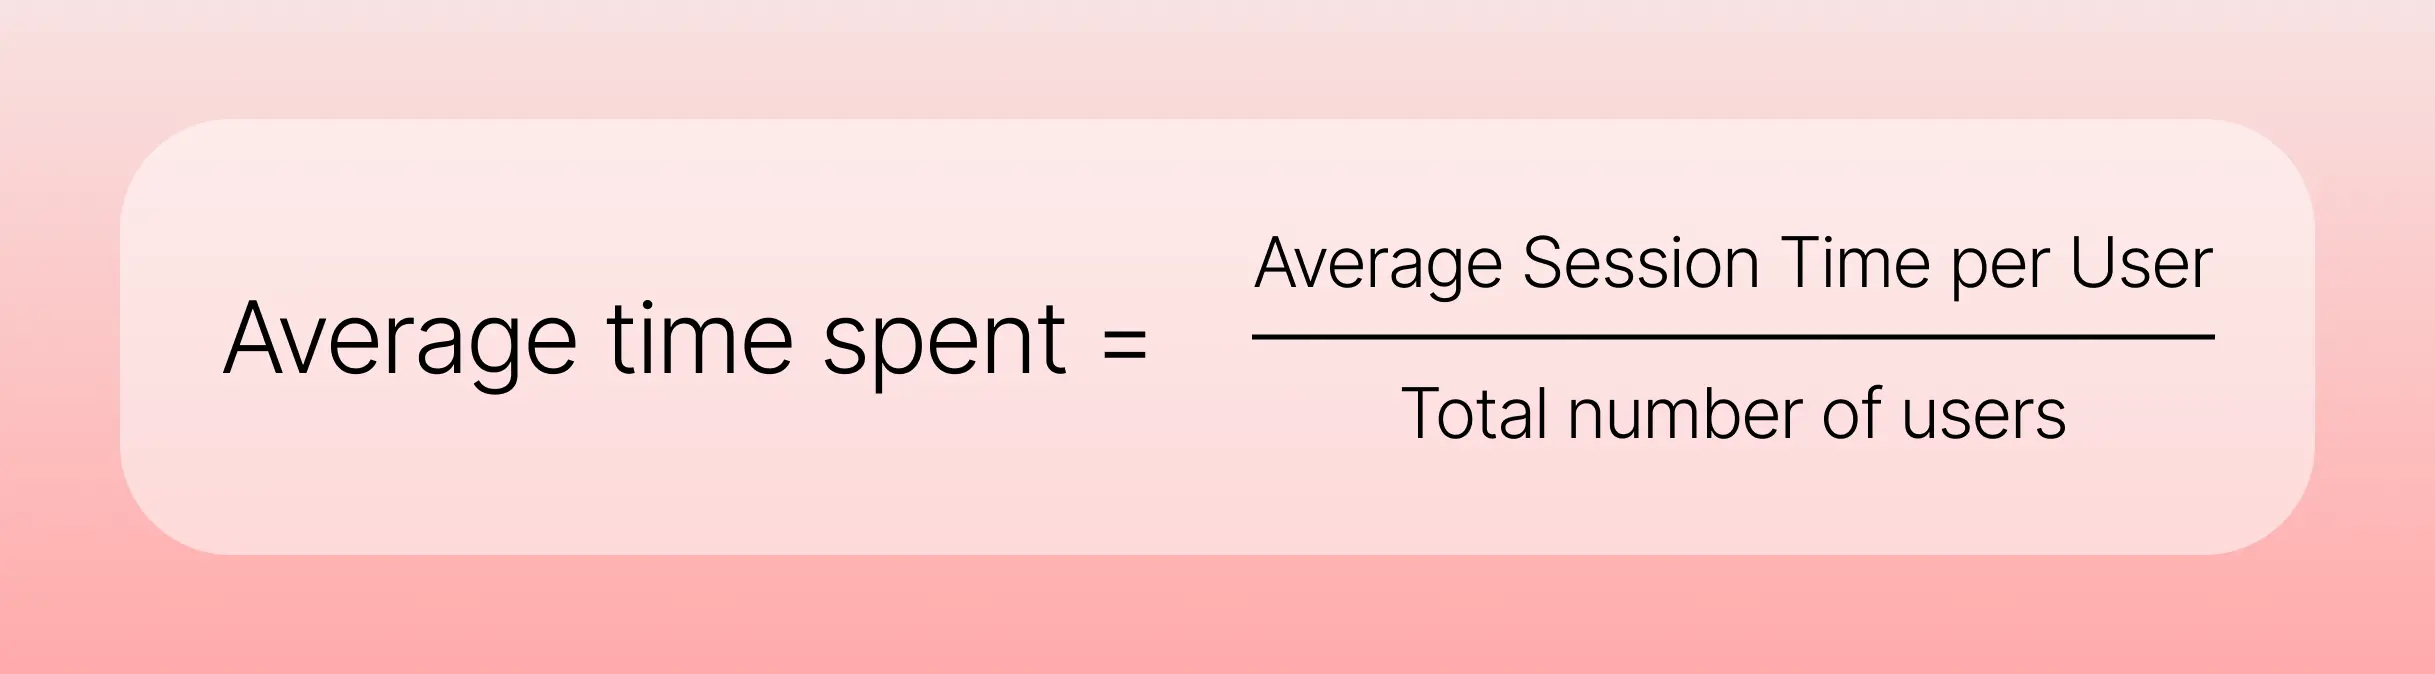
To measure the average time spent in platform, add up the average time spent in a single session by users during a certain time frame by the total number of users in that time frame. Like frequency of use, you can break this down into any time frame that’s relevant to the analysis you’re trying to do.
You can also break this metric down by segments to see not only overall time spent, but also trace long or short usage to certain groups of users.
Using analytics to improve customer engagement
Once you have all of this data that you pulled out of your customer engagement analytics, you can make direct actions to increase engagement.
Make product improvements
The metrics you pull may have given you a fresh perspective on how your users are actually interacting with your product. You can use this to enhance or change your product in strategic ways.
For example, let’s say you notice that there are some features that are rarely used, so you can either scrap them, improve them, boost their visibility, or provide more guidance on how to use them. Let’s say you notice a low time-in-platform for that certain feature, paired with an overwhelmingly frustrated sentiment analysis. This could be a clue to provide some more education with things like step-by-step walkthroughs for new users of that feature.
Create user segments
You can also use your customer engagement analytics for highly relevant segmentation. You can use these segments to tailor your marketing and support efforts.
There are a few ways you could do this:
- Behavior-Based Segmentation: Group users based on their interactions with your product, such as frequency of use, types of features used, or stage in the customer lifecycle.
- Demographic Segmentation: Combine engagement metrics with demographic data to create more personalized campaigns.
- Predictive Analytics: Use predictive analytics to identify which segments are most likely to churn or upgrade, and tailor your strategies accordingly.
Craft personalized experiences
Personalization is not only a major differentiating factor for your product, but it’s also a growing expectation from consumers. In addition to using your engagement data to craft segment-wide personalization, you can also use it to drive hyper-specific personalization to a specific user. Implementing strategies such as text subscriptions can further enhance engagement by providing timely, personalized messages directly to users' phones.
For example, you can leverage engagement data to recommend content, products or features, as determined by their individual preferences or pain points. Let’s say that someone is a power user of a specific tool. They probably don’t need any nudges to use it. Maybe it’s time to help them level up by encouraging them to give another feature a try.
Engagement is the pulse of your product
What is the purpose of a product if not to have people use them? If you’re not optimizing for engagement, you’re not helping your product live up to its full potential.
When you leverage your customer engagement analytics, you can make better, more informed decisions about how to enhance your product, target users better, and overall create more thrilling and profitable products.