We all know measuring your users' activity and engagement with your software product is very important. One of the main ways folks measure user engagement is through daily, weekly, and monthly active user statistics. These all measure the number of active users for a specific time period and give insight into your users’ activity and engagement patterns.
But it can be challenging to understand precisely how to measure each of these, whether they're essential or not, and how to understand them in the context of your business.
Let's dig into these three different metrics and put them in perspective against other metrics.
What is DAU? What is WAU? What is MAU?
You're probably familiar with these three acronyms, but just in case, let's break them down:
Daily Active Users — DAU
Daily active users, or DAU, are the number of unique users who use your application on a specific day.
Measuring this is pretty simple: you calculate the total number of users for one calendar day.
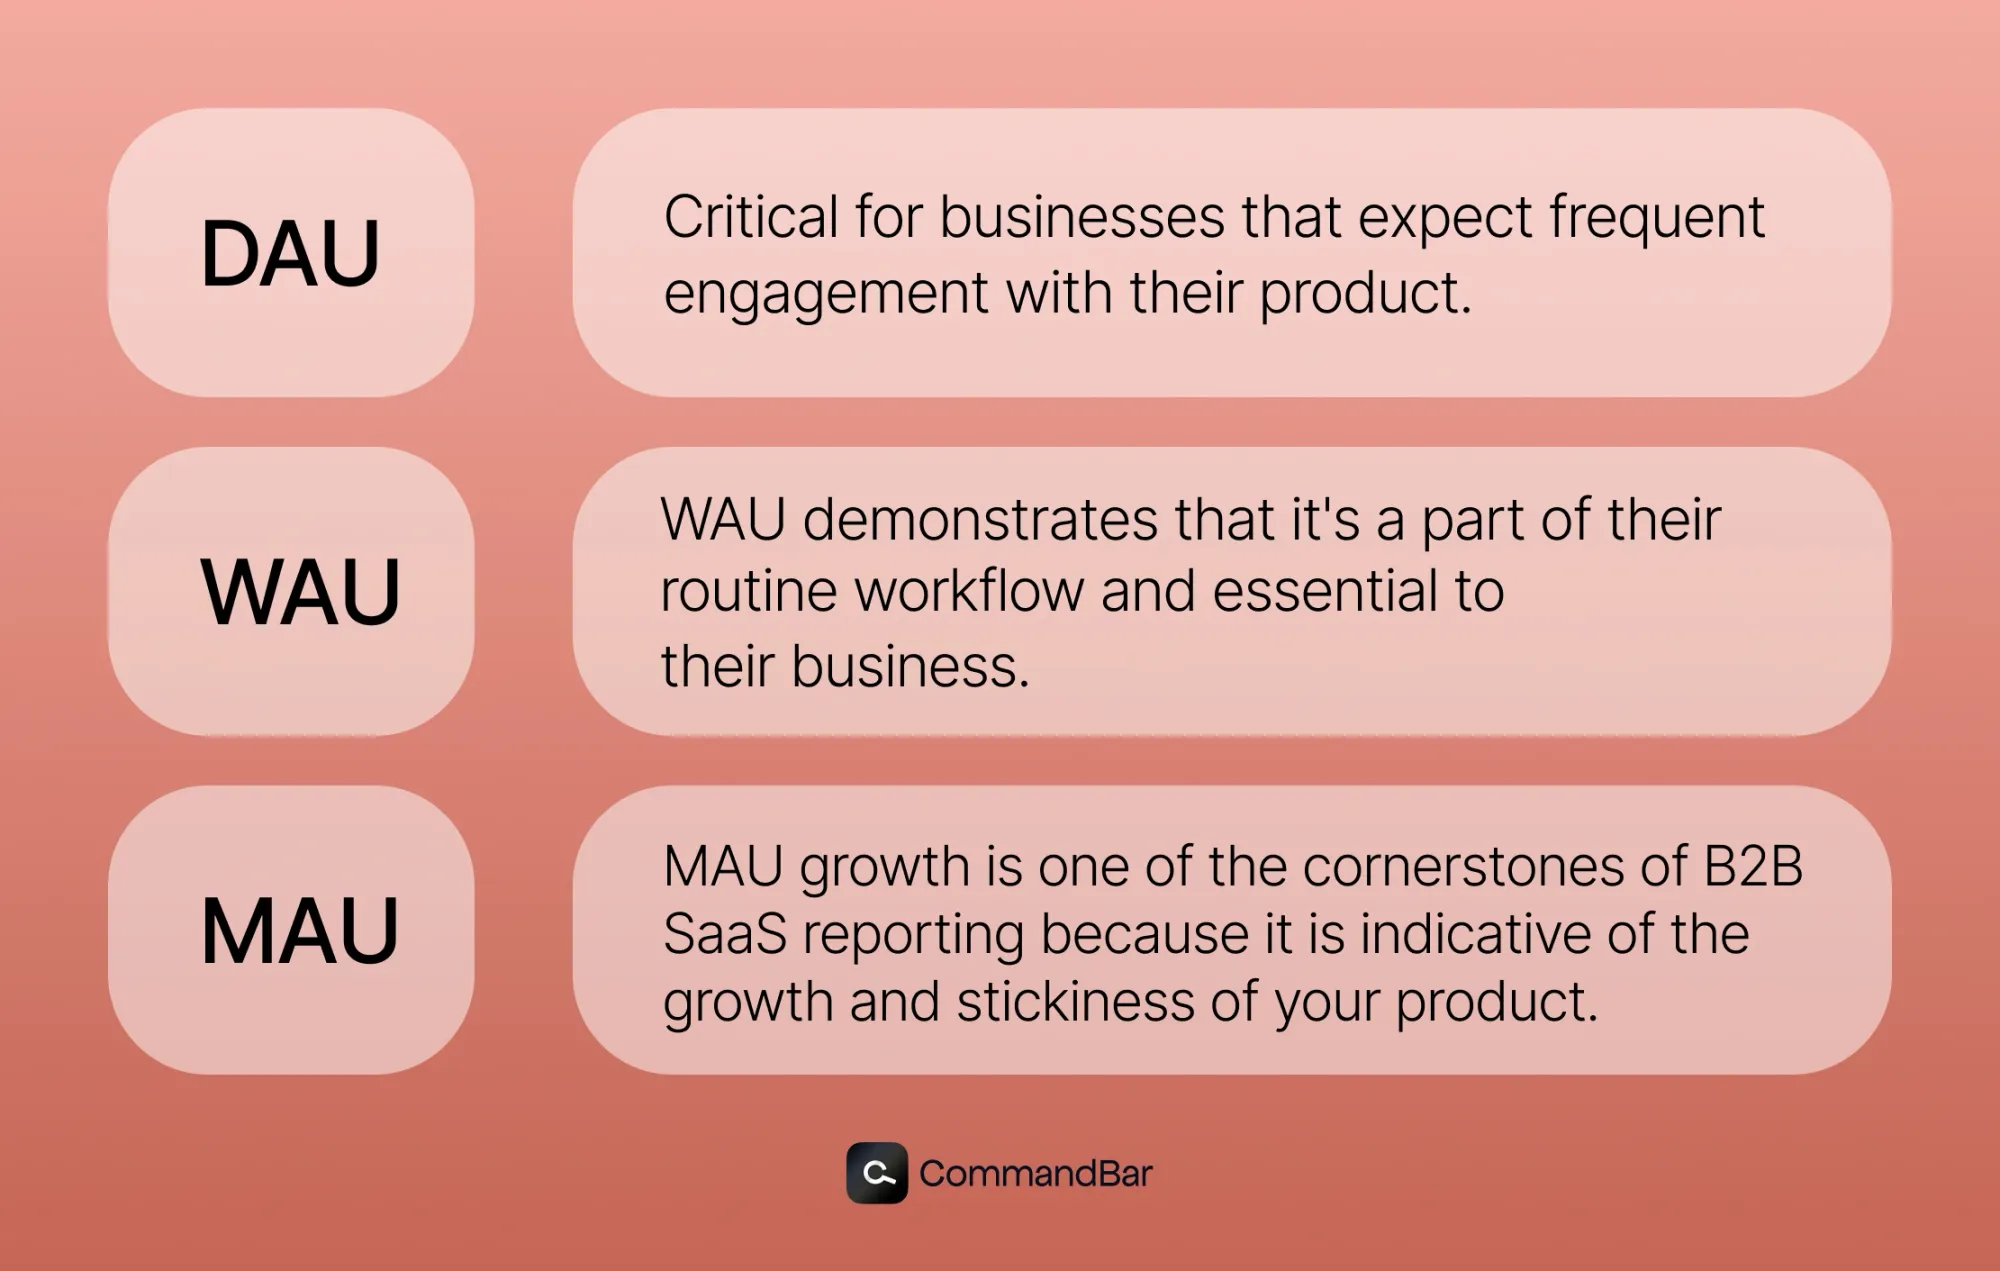
DAU is critical for businesses that expect or want repeated and frequent engagement with their product. This is more common in B2C businesses than in B2B SaaS companies.
Weekly Active Users — WAU
Weekly active users, or WAU, represent the number of active users for one specific week.
To keep this consistent, you'll want to define the start of the week: is it Monday? Sunday? And what time zone?
WAU is a popular metric because user engagement on a weekly cadence can be a good barometer for user involvement in your software. While they may not need to use it daily, weekly use demonstrates that it's a part of their routine workflow and essential to their business.
Monthly Active Users — MAU
Monthly active users, or MAU, represent the number of unique folks who engage with your product in one month.
You want to make sure you're using calendar months or 30-day increments (calendar months are the easiest, but naturally, you'll have an unbalanced number of cohorts because of the number of days in a month) and keep things consistent.
Monthly active user growth is one of the cornerstones of B2B SaaS reporting because it is indicative of the growth and stickiness of your product.
What does being “active” mean?
One of the biggest headaches with these activity metrics is setting them up and then realizing months later that what you considered an “active user” was not very well-defined or accurate to your business.
For example, if you go based on the number of users who log into the product as an “active” user, you might have an inflated number that doesn't capture the actual number of folks who take action on your product.
On the other hand, if you're too stringent and tie the metrics to something too specific, you might be underrepresenting your numbers.
Talk with your team and clarify what an active user represents.
Is it an action they take?
Is it over a certain amount of time in the product?
Whatever you decide on, make it consistent and make it universal.
Comparing DAU vs WAU vs. MAU
All three of the metrics should be measured and followed closely.
But it's essential to place them in the context of your user base and your expectations and desires for their behavior.
For example, if you're providing payroll solutions, it shouldn’t surprise you that your software is being used around the end of the pay periods, not every day. In this case, WAU or MAU numbers better represent your performance than DAU trends.
On the other hand, if your software helps graphic designers create unique images, you might be more keen on seeing repeated daily usage because it's a core part of the workflow and it's not time-specific.
Finally, if you're selling on a seat-by-seat basis, monthly active users are more helpful because you have many infrequent users and a small cohort of power users (folks get invited and join but don’t do much in tools like Miro or Canva often, maybe just a few times a month). Monthly active users give you a better sense of total engagement with your product than daily active or weekly active users, but you would also want to look at the shorter time frames to ID the power users.
Monthly active users are also the primary metric through which growth is measured because it's got a long enough time period to be meaningful but not so long to lack granularity.
What to do with all this activity data?
Even if you gather all this data, it could be challenging to understand what it means if there are significant disparities between your different cohorts.
Let's walk through some common scenarios.
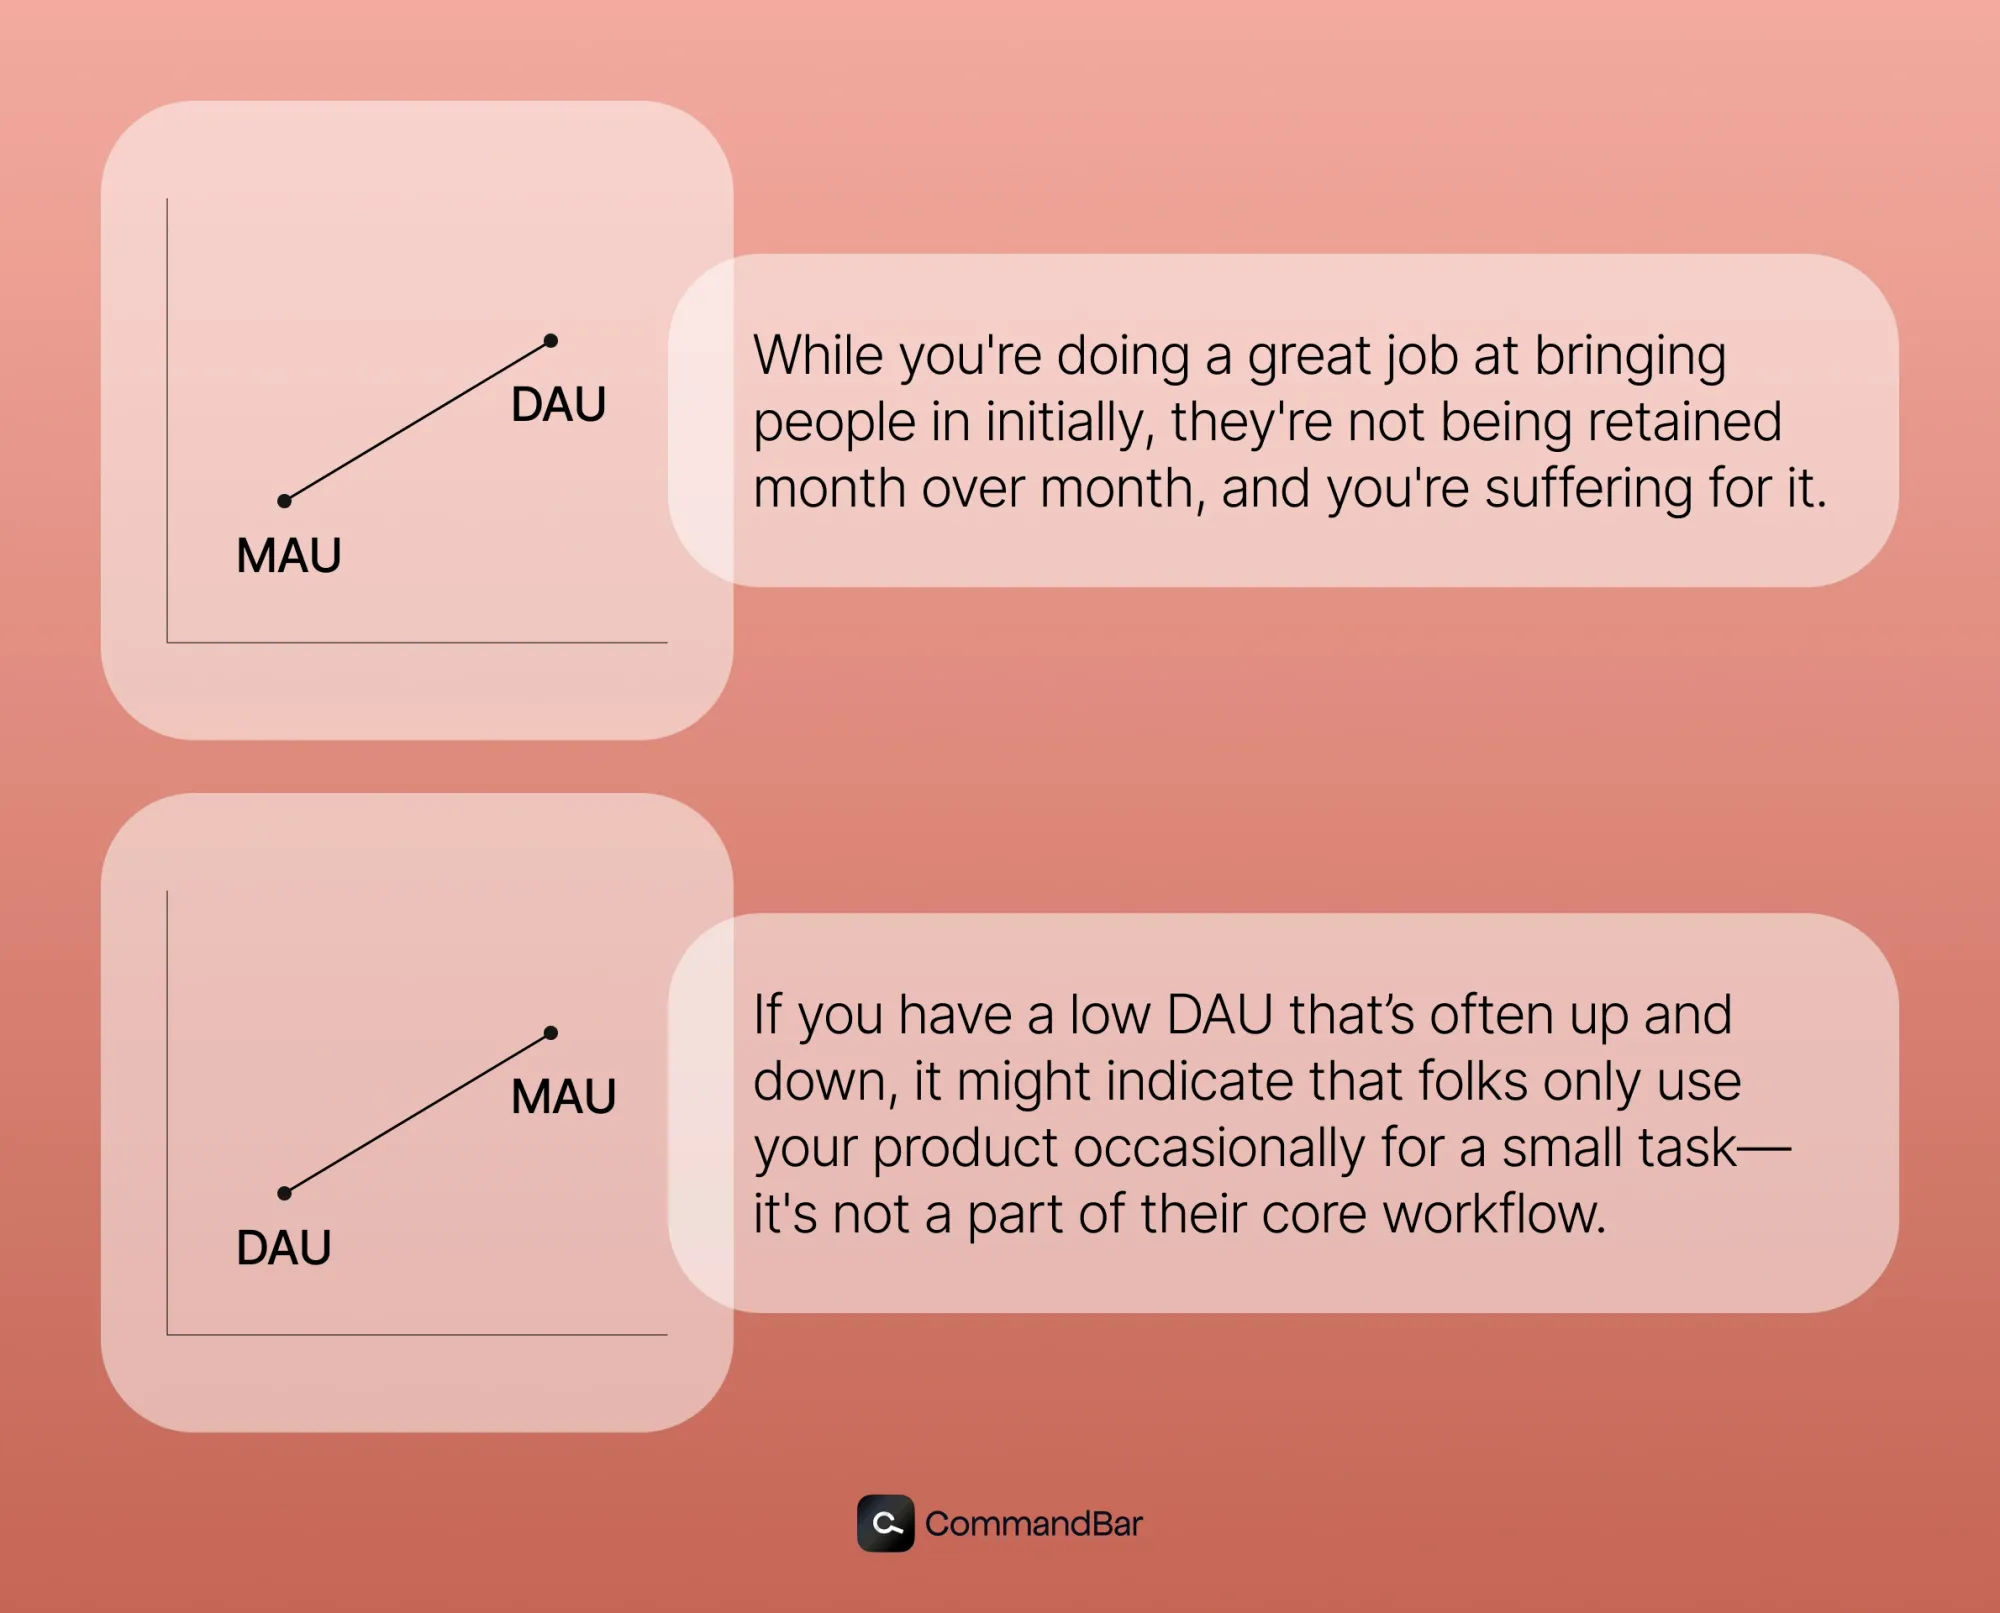
High DAU but low MAU
You occasionally have spikes of high daily activity, but your MAU numbers are inconsistent and low. This might indicate that while you're doing a great job at bringing people in initially, they're not being retained month over month, and you're suffering for it.
High MAU but low DAU
This is preferable to the above because you've got a solid number of folks engaging with your product every month. If you have a low DAU that’s often up and down, it might indicate that folks only use your product occasionally for a small task—it's not a part of their core workflow. You might want to look for ways to draw them back into the application with new features or messaging.
High DAU & High MAU
This is a dream come true. You've got a highly active daily user base that engages with your product, and those folks are consistent, so you've got a high MAU base.
What to watch out for
It's not enough to gather all this data at a high level. To make it insightful, you need to break down each of these three metrics by:
- Persona
- Feature
- Lifecycle (onboarding, activated, veteran, etc.)
Additional ways to segment this data include enterprise versus startup, team size, or anything else necessary to your business.
You need to do this because it gives you a better understanding of your user behavior at a more granular level. For example, if you suspect certain groups of power users consistently drive the bulk of your high-performing DAU:MAU numbers, you might segment them into cohorts. Once you step outside that cohort, you may struggle with retention.
Or, a specific feature within your product performs well, but the others struggle.
Remember: data is excellent, but it's only beneficial as it's segmented and understood in context with your business.
Look beyond activity numbers
It’s important not to get bogged down in these three numbers exclusively. You need to personalize your expectations for your vertical and your user cohort.
The growth numbers and ratios that you expect for an enterprise tool for finance are very different from those of a graphic design tool for creative professionals. You should look for improvements in your data, not to achieve some golden number.
You must also examine other metrics about your DAU, WAU, and MAU numbers.
We've got an extensive number of articles on this like our product metrics article, but to list just a few:
- User retention metrics — understand your retention by cohort across one month, three months, six months, and beyond
- Customer effort score — understand how easy it is for your users to interact with your product
- NPS — understand your user satisfaction and love for your product
- Onboarding funnel conversion — learn how your users are converting from onboarding into onboarded and active
There are a billion metrics to track, but these are a few key ones to compare against your activity metrics to get a better sense of your business.
Getting lost in an active user rabbit hole is likely a recipe for misdirected product development and strategic thinking, particularly for most B2B SaaS products.
Conclusion
You should look at your activity numbers in the context of your overall business. Align your goals for DAU, WAU, and MAU numbers with the reality of your business, and be sure to segment them across your different user personas, features, and more. This way, you can not only boost your active user account but also the metrics that matter like retention, sales, and more.